Where I Stand, According to Figure 15
My recent symptoms-setback has forced me to reevaluate where I stand in treatment. I figured I would be part of the “stall phase” camp, those individuals that experience little to no symptom relapses, but rather a temporary plateau of symptom improvement. The last few weeks have opened my eyes to the possibility that a plateau was merely wishful thinking.
According to figure 15 on page 52 of “Amalgam Illness: Diagnosis and Treatment by Andrew H Cutler, PhD,” the dump phase is graphed to present itself somewhere between six- to nine-months following dental amalgam removal. Following this dump phase, symptoms again start to slowly improve.
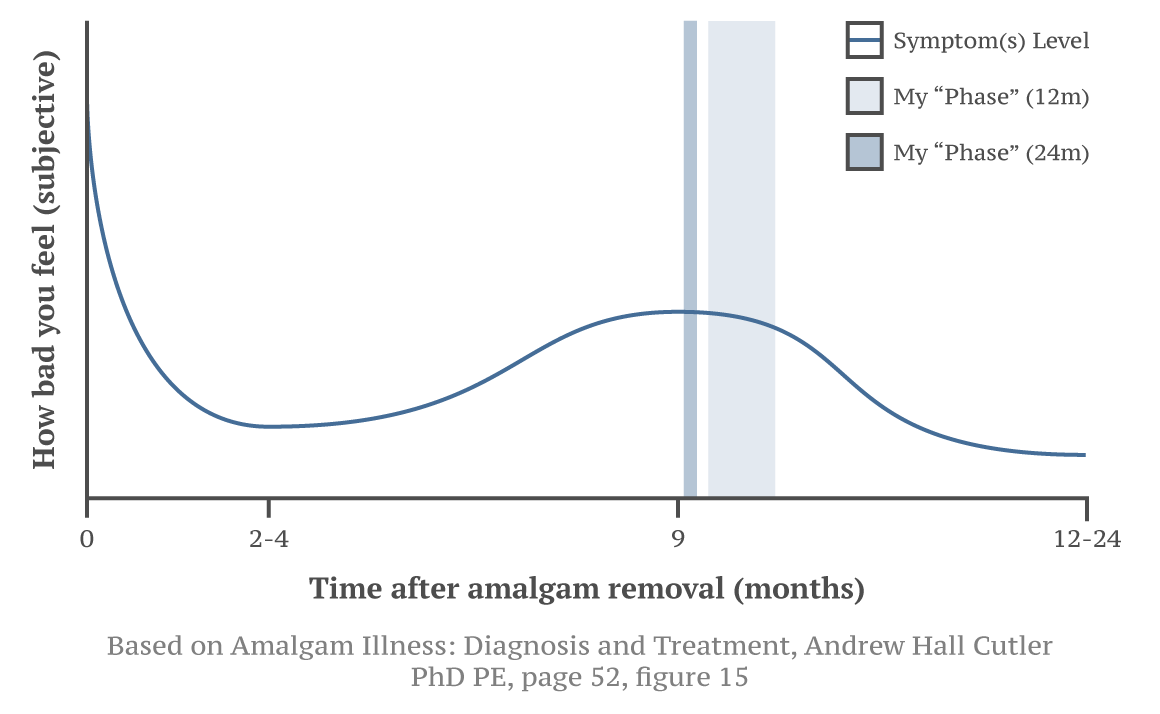
I was curious to see where I was, so I created a new chart, based off of Dr. Cutler’s figure 15, and marked where my “dump phase” fell. First, I determined that my first recorded entry about symptom reversal was on September 7th, 2014. I then calculated how many true rounds into the protocol I was. Since I have had a few rounds end early, using the current round count (46, as of this writing) would be incorrect. After crunching some numbers, I came to 42.19-weeks, or 9.7-months in.
In the chart above, the vertical bars represent two possible ranges my “dump phase” currently falls within. The darker bar represents where my “dump phase” fell if the journey lasts 24-months, whereas the lighter bar correlates with a 12-month battle. While I was hopeful that 12-months would work for me, the experiences of others have helped me redefine the finish line at 24-months or greater.